Home
Table of Contents
Synthesis
Emotions
Interactions
Research Information
The Other Side
Strategic Use
Lesson Plan
References
Research Information
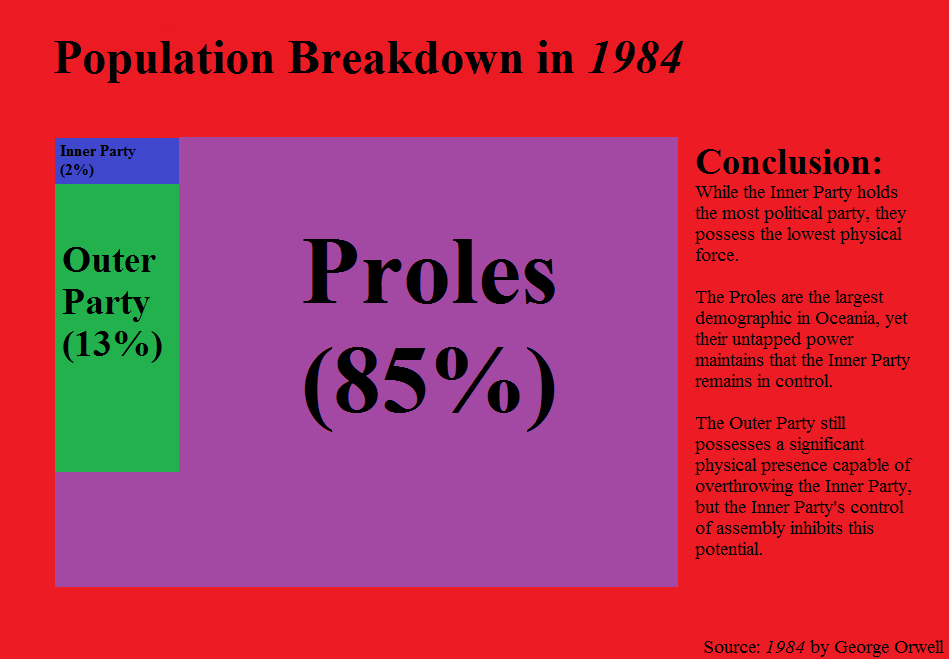
Chart Representation
Charts are a quick and effective method to communicate to your reader an important aspect of your text. In this chart, I analyze the population breakdown in
1984
and how that speaks to the potential of the social movement.
Home
Table of Contents
Synthesis
Emotions
Interactions
Research Information
The Other Side
Strategic Use
Lesson Plan
References